I am going to begin with a disclaimer: Stats do not tell the whole story. Do not form opinions solely on numbers. Statistics are just objective data (without hype that affects perception) used to back up subjective opinions, and nothing more.
Now, statistics may not tell the whole story but what they do tell is a part of the story; your eyes tell the rest of it and give the numbers life. Like I said in my previous article on statistics, when statistics lack context, they should be rejected or ignored. Hence, I have done my best to give as much context to this analysis as possible. I incorporated all measurable/available data so that more sense can be made of all the figures that appear.
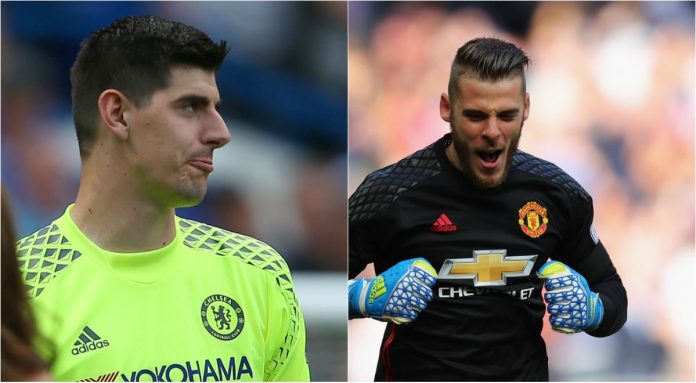
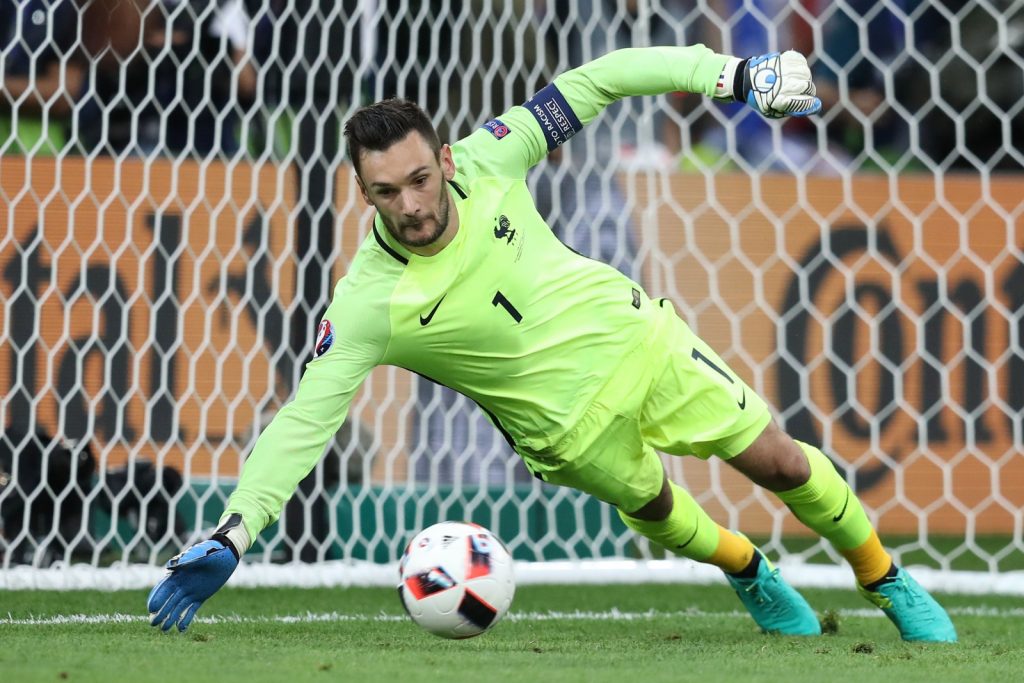
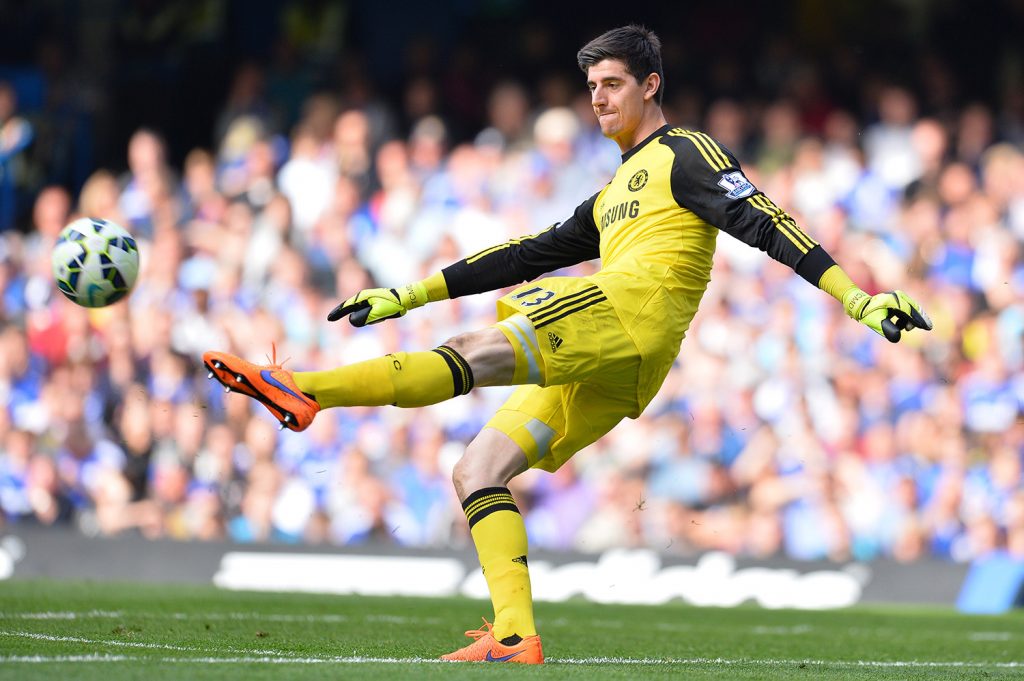
When asked about who the best goalkeeper in the Premier League is, I have said time and again it is Thibaut Courtois. I know, on the surface of things, it looks like a ridiculous assertion because of the popular view. I have also often said that only Hugo Lloris is on par or *could* be considered better, depending on a few things.
The obvious question that always comes is, “are you crazy mate? How about David De Gea? You clearly have an agenda!” That is expected. The man has been a regular in the PFA Team of the Year. He has made amazing saves time and time again, especially when his team kept flopping. He has generally been good. I know everything you want to say, and I agree with most of it. There is however, a lot more to consider.
Before you think this is an article about how Courtois is the best thing since Zidane, I want to state this; I have done my best to avoid confirmation bias in the compilation of all of this data. I will do the same in the analysis to follow. What I am trying to achieve with this is myth-busting basically. A lot of things you will see will surprise you. Walk with me.
Key terms need to be set out for starters. Before making any assertions about Courtois’ prowess, I will define certain parameters.
“High Claims”, which is about crosses claimed, tells us how many times danger, which came aerially, was avoided. A ball the goalkeeper doesn’t claim or attempt to claim can easily lead to a chance which can lead to a goal. Of course, the cross can be one which is easy to get to, but you’d see from these numbers that some goalkeepers consistently claim a lot of crosses compared to their peers. Height or not, that is a strength as it averts danger.
“Sweeper Clearances” is another way a goalkeeper prevents danger/a chance as he anticipates danger and by quickly getting off his line, timing his run to perfection and clearing the ball. “Catches” might most likely be as a result of feeble shots which are easy for the goalkeeper to claim. That notwithstanding, it still represents a threat in & around the goalkeepers zone which he deals with.
“Punches” are largely ignored when looking at goalkeeper stats, which is weird because they are just as important as saves. In fact, it is a kind of save; one which gets rid of danger with little to no flamboyance involved. A good number of punches usually come as a result of aerial threats; another thing worth noting.
What the “Goal Kicks” stat shows is how many times opposition players shot off target without the goalkeeper really having to make a save or do anything at all. It shows the level of potency of opposition players that the goalkeeper has faced. The higher the number of goal kicks, the lesser the potency/accuracy of the opposition faced.
“Accurate long balls” stat shows how important the goalkeeper is in starting an attack (or counter attack) to help his team. Although not considered a primary attribute, as a secondary attribute, it can still be a useful attribute to have in a goalkeeper, just like “Passing”. After all, the goal of football is to win games. If your goalkeeper helps you do that by supplying more accurate long balls that help the attack, brilliant.
I created three stats using the data available. “Defensive Actions per game” is a summation of everything the goalkeeper had to do to avert danger/prevent a goal per game. That is;
— (Saves + High Claims + Punches + Catches + Sweeper Clearances)/Number of Games Played.
“Threats” is a summation of every dangerous scenario the goalkeeper had to deal with. This does not factor in goal kicks because that is based on shots off target which isn’t a real threat for the goalkeeper. This does not mean that the goalkeeper couldn’t have played a role in making the shooter shoot waywardly. But it is more often as a result of poor composure, finishing & accuracy which are more on the opposition player. For threats, I added goals conceded which are the threats the goalkeeper could not successfully deal with. Thus;
— (Saves + High Claims + Punches + Catches + Sweeper Clearances + Goals Conceded)/Number of Games Played.
“Failure Rate” is the rate at which a goalkeeper couldn’t deal with the number of threats he faced. This is an important stat because it directly relates the threats faced with the goals conceded. This gives us a clear picture of how each goalkeeper handled danger around his area.
I’ve seen a lot of conjecture about threats faced by various goalkeepers and how they handled it, with many relying solely on flawed premises. This stat puts everything into perspective and is the culmination of the entire data sheet. It should be a key metric in determining just how well each goalkeeper has performed in the period under review. That is;
— Goals Conceded/Threat Faced.
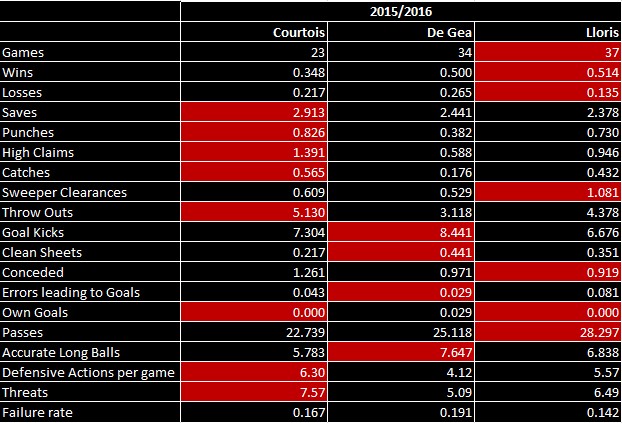
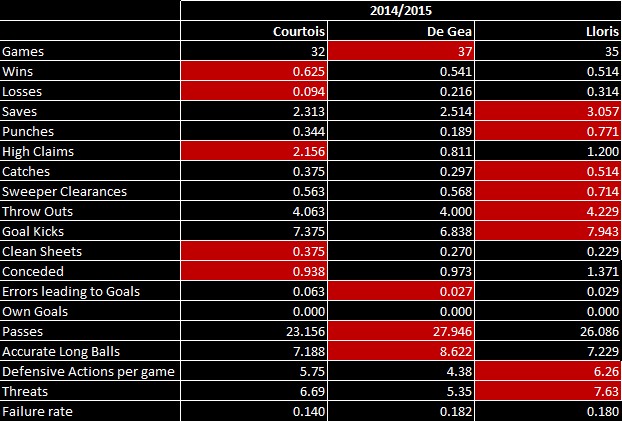
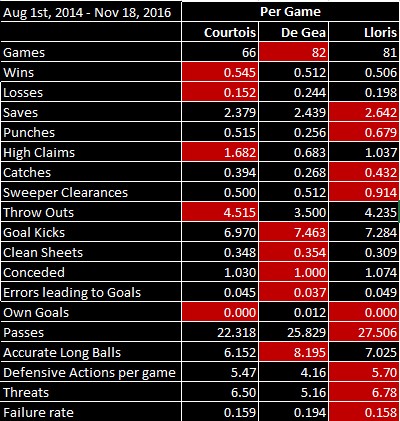
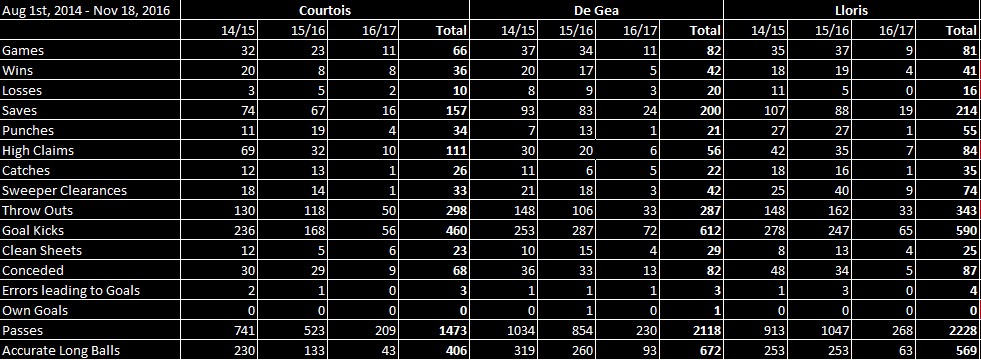
To avoid accusation of confirmation bias, I’ll simply give you the data I have compiled to back my Courtois assertion. You can draw your own conclusions from them. Remember to also apply context of what you have watched to it. Here, I picked Courtois alongside his opposite numbers at Manchester United and Tottenham Hotspur.
If you feel your perception of things was impaired by hype, you can re-watch many of the games these goalkeepers were involved in, armed with this data. You might start to notice things you haven’t noticed before. Also, you will see the glaring weaknesses and strengths of each goalkeeper.
Written by Astorre V. Cerebronè (@Cerebrone)
