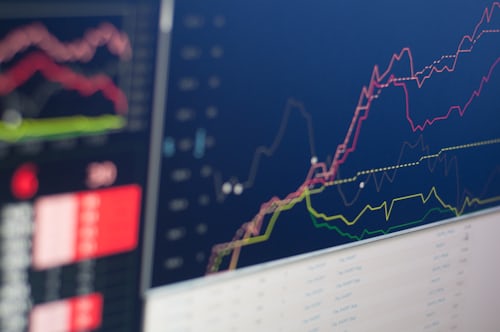
When a market order triggers a limit order this is shown in the footprint chart. Depending on how many contracts have been traded, the numbers in the chart will increase. It is very important to know that the footprint chart only shows the traded volume in the past.
There are also many other setting and display options of the footprint. In this article you can read about it in more detail.
On the right side there is the volume of the Ask. Market orders trigger the limit orders (sell limit). On the left side there is the Bid (buy limit). Market Orders trigger these buy limits. The VPOC is also shown in my example. It shows the price with the highest volume.
The red and green numbers show me aggressive buyers and sellers, this setting is customizable depending on the trading style. Thus I filter extremes from the market and know on these prices there was a strong buy or sell. The VPOC can again be used as a trend indicator in how to trade stock. If the VPOC rises continuously we are in an uptrend and vice versa. Once there is a change in the VPOC trend and volume shifts in another direction, it is possible to speculate on a trend reversal.
Support and resistance with the Footprint Chart
You may be surprised in normal chart trading that a support or resistance does not hold and the market breaks right through it. The result is losing trades. The Footprint Chart with the displayed volume can help you enormously with this trading style. I use the footprint chart for additional confirmation and wait to see if the market gives me a signal. You can see very easily if the support is holding or not. Of course there is no 100% hit rate here, but the following example will help you a lot:
On the left side, we see very aggressive sellers based on the red numbers, but the market is not going lower. Moreover, the VPOC is at the bottom of the wick of the candle. The market is going up! Despite high volume, the market is going up. This is a sign that many sellers are trapped or Big Profits have been taken. When the market is at support or resistance, forming a wick where the VPOC is, this is a perfect confirmation signal for a short trade.
High volume forms at a point where the market turns. This is where large counter positions were opened or profits were taken.
This is how Forex Volume Trading works!
In Forex trading we need to distinguish between 2 markets. There is the spot forex market and the futures market. The spot forex market is the interbank market with extremely high liquidity. Most of the volume is transacted here. It works decentralized between different banks or networks. In the future forex market, you trade contracts on a central exchange. The volume is not as high as in the interbank market, but the future influences the movements.
However, as a trader, we can use the data from the Euro futures, Yen futures, etc. to trade the spot forex market. This works best through an ECN broker. However, the spot forex market only partially follows the movement in the future. There can sometimes be strong deviations here. Therefore, it is more advisable to use larger time units.
If you want to trade Forex via the spot market at a Forex broker and use the future for analysis, I recommend you also plan more space for the stop loss, because there are always deviations from the future to the spot market. These are quite small, but they do occur sometimes.


[…] variety of football seasons, so also the times and periods that people get to place their bets. The English Premier League is one common one that most people always tend to look out for in Nigeria. You can also bet on La […]